

 Download PDF
Market Overview
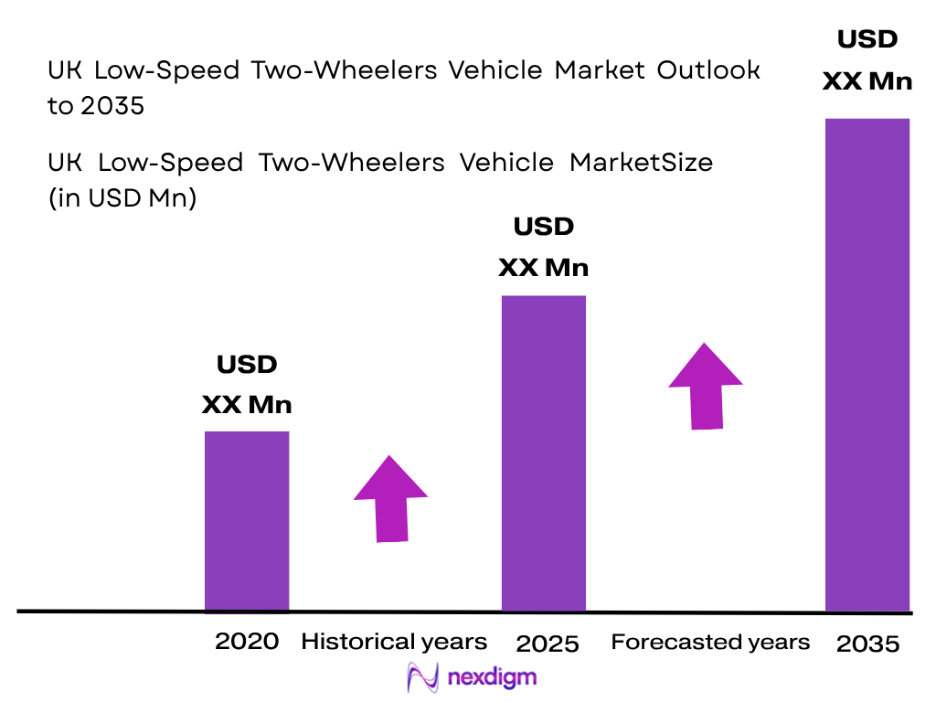
The UK Low-Speed Two-Wheelers Vehicle Market is valued at ~USD XXX million, with the closest published core-market benchmark placing the UK e-bike market at USD 283.22 million. The Bicycle Association recorded approximately 146,000 e-bike sales in the latest completed annual dataset. Demand is supported by commuting, Cycle to Work access, last-mile logistics and short-distance mobility; nationally, 70 out of every 100 trips are under five miles, creating a substantial addressable journey pool.
Dominant Locations: London is the principal UK demand centre because of dense employment clusters, extensive cycling infrastructure, shared-mobility availability and strong first/last-mile use. Daily cycling journeys increased from 1.26 million to 1.33 million, while London’s rental e-bike fleet expanded from 27,694 to 37,694 vehicles across the corresponding observed periods. Manchester, Bristol and other major English urban centres also benefit from compact journey patterns, active-travel infrastructure, delivery demand and participation in regulated micromobility schemes.
Market Segmentation
By Vehicle Type
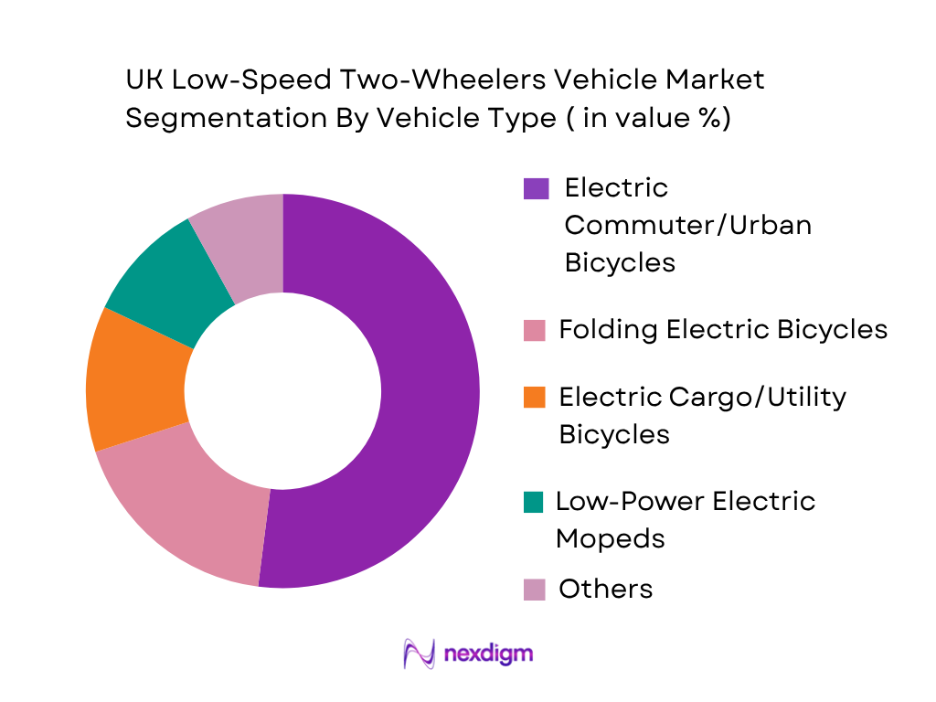
The UK Low-Speed Two-Wheelers Vehicle Market is segmented by vehicle type into electric commuter/urban bicycles, folding electric bicycles, electric cargo/utility bicycles, low-power electric mopeds and regulated rental e-scooters. Electric commuter and urban bicycles hold the dominant share under this segmentation. Their leadership is supported by the UK EAPC framework, under which compliant pedal-assisted bicycles can be used similarly to conventional bicycles without the licensing, registration and insurance obligations that generally apply to mopeds. Their suitability for commuting, leisure and multimodal journeys also gives them a broader consumer base than commercial cargo models or regulated mopeds. The category benefits from established bicycle dealer networks, employer-supported Cycle to Work purchasing, removable-battery models and growing availability of mid-drive and hub-drive systems. London’s rapid expansion of cycling activity and shared e-bike use further demonstrates the suitability of electrically assisted bicycles for dense British cities. The Bicycle Association’s reported e-bike volumes also indicate that EAPCs remain the central commercial product class in the addressable low-speed electric two-wheeler ecosystem.
By End Use
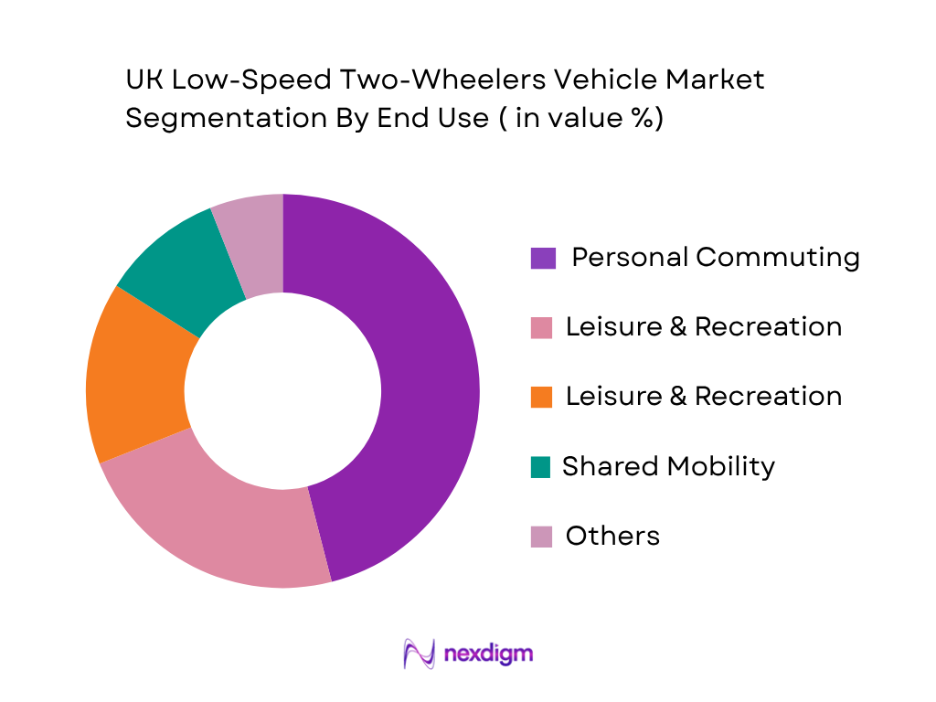
By end use, the UK Low-Speed Two-Wheelers Vehicle Market is segmented into personal commuting, leisure and recreation, last-mile delivery, shared mobility and institutional/corporate mobility. Personal commuting represents the dominant sub-segment because low-speed electric two-wheelers address one of the largest practical mobility gaps in British cities: short journeys that are lengthy on foot but inefficient by car. Department for Transport data show that a large majority of trips are relatively short, strengthening the addressable use case for assisted bicycles. Commuters also benefit from the ability to combine folding e-bikes with rail travel, while electric assistance reduces the physical barrier posed by hills, distance and carrying work equipment. London illustrates the trend particularly clearly, with cycling activity increasing alongside large shared e-bike fleets and growing first/last-mile usage. Employer salary-sacrifice arrangements and specialist financing additionally reduce the effective acquisition burden for eligible consumers, improving the category’s attractiveness relative to more highly regulated electric mopeds.
Competitive Landscape
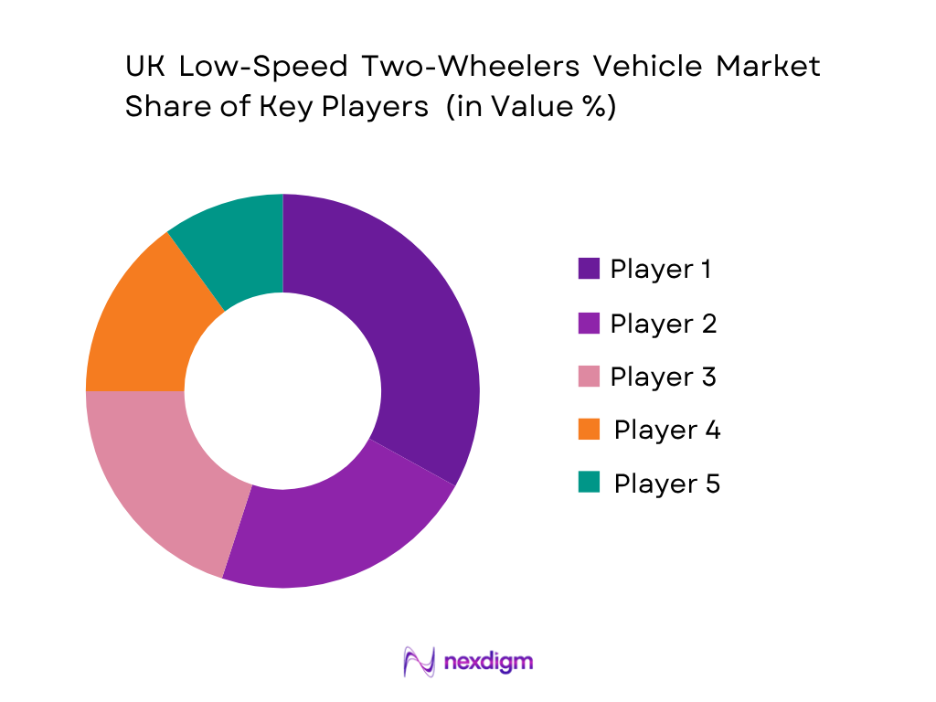
The UK Low-Speed Two-Wheelers Vehicle Market is fragmented across British specialists and large international bicycle and electric-mobility brands. Brompton has a particularly differentiated position in folding urban mobility, while Specialized and Trek compete through broad premium dealer-led portfolios. NIU strengthens competition in road-legal electric mopeds, and VOLT represents a UK-focused electric-bicycle specialist. Competition increasingly revolves around compliant motor output, battery range, vehicle weight, removable batteries, dealer/service availability, theft protection, connectivity and lifetime ownership cost rather than headline motor power alone. Brompton traces its folding-bike concept to London in 1975, Specialized has operated since 1974, and Trek was founded in Waterloo in 1976.
| Major Player | Established | Headquarters | Core UK Low-Speed 2W Focus | Motor Architecture | Battery Strategy | Primary Use Case | Sales Model | Key Competitive Differentiator |
| Brompton Bicycle | 1975 | London, UK | ~ | ~ | ~ | ~ | ~ | ~ |
| VOLT Bikes | 2010 | London, UK | ~ | ~ | ~ | ~ | ~ | ~ |
| Specialized | 1974 | Morgan Hill, USA | ~ | ~ | ~ | ~ | ~ | ~ |
| Trek Bicycle Corporation | 1976 | Waterloo, USA | ~ | ~ | ~ | ~ | ~ | ~ |
| NIU Technologies | 2014 | Beijing, China | ~ | ~ | ~ | ~ | ~ | ~ |
UK Low-Speed Two-Wheelers Vehicle Market Analysis
Growth Drivers
Urban Congestion and Expanding Cycling Infrastructure
Urban congestion is strengthening the role of e-bikes as a practical mobility option in dense metropolitan areas where conventional road transport increasingly competes for limited street capacity. The global population stood at approximately 8.1 billion people in 2024, providing the demographic base for continued expansion of urban mobility demand, while the World Bank records global carbon dioxide emissions excluding land-use change at 4.7 tonnes per person in 2024, reinforcing the policy pressure on cities to shift short-distance journeys toward lower-emission transport. The economic environment supporting transport investment is also substantial: World Bank data place global GDP at approximately USD 110.98 trillion in 2024, meaning urban transport systems operate within an economy generating more than USD 110 trillion of annual activity and therefore face significant productivity consequences from congestion and inefficient short-distance travel. E-bikes are particularly relevant because they extend practical cycling distances without requiring automobile-scale road or parking space and can use much of the infrastructure developed for conventional bicycles. Europe provides clear evidence of the infrastructure base supporting this transition. In 2025, European Commission-supported mapping identified more than 900,000 kilometres of cycle paths across Europe, while national cycling contact points were established across 26 EU Member States and more than 270 cycling-related measures were identified through European urban-mobility coordination. The same European policy framework is expected to deliver more than 12,000 kilometres of new or upgraded cycling routes through existing investment programmes. Policy support also became more explicit in 2024, when the European Parliament, Council and Commission adopted the European Declaration on Cycling, including commitments for coherent cycling networks, integration with public transport, secure bicycle parking and access to charging facilities for e-bikes.
Low-Emission Mobility and Sustainability Targets
Low-emission mobility policies are creating structural demand conditions for e-bikes because urban transportation is increasingly being evaluated against measurable emissions, road-space and energy-efficiency objectives rather than mobility volume alone. World Bank indicators place average global carbon dioxide emissions excluding land-use change at 4.7 tonnes per person in 2024, compared with 13.6 tonnes per person in the United States and 5.5 tonnes per person across the European Union, demonstrating the scale of transport and energy decarbonisation challenges facing large consumer economies. These environmental pressures sit within a global economy that generated approximately USD 110.98 trillion of GDP in 2024, making the transition toward lower-emission urban transport relevant not only to climate policy but also to the functioning of major employment, logistics and consumption centres. E-bikes fit this policy direction because they require substantially less physical road space and vehicle mass than passenger cars while retaining powered mobility for commuters who may consider conventional cycling impractical because of distance, gradients, cargo requirements or physical effort. Government policy during 2024 and 2025 provides direct evidence that authorities are integrating cycling and electric micromobility into decarbonisation strategies. The European Declaration on Cycling adopted in 2024 formally committed EU institutions to stronger cycling networks, improved connections between cycling and public transport, secure parking and access to e-bike recharging infrastructure. By 2025, European Commission reporting identified more than 900,000 kilometres of cycle paths across Europe and a coordinated network covering 26 Member States, providing a physical platform on which e-bike adoption can expand.
Market Challenges
Battery Safety and Certification Requirements
Battery safety is one of the most significant operating challenges for the e-bike market because lithium-ion failures can create fire, property, regulatory and reputational risks that extend beyond individual products. Official UK product-safety data show that authorities received reports of 170 e-bike fires during 2024. Of these incidents, 77 involved e-bikes confirmed as post-market electric conversions, illustrating the particular risk created when batteries, chargers, controllers and bicycle platforms are assembled or modified outside tightly controlled original-manufacturer systems. UK authorities were also notified of 39 e-scooter fires during the same year, demonstrating that lithium-powered micromobility safety is being treated as a broader product-regulation concern rather than an isolated e-bike issue. The regulatory response intensified after these incidents. In December 2024, the UK government issued statutory guidance covering lithium-ion batteries used in e-bikes and requiring safety mechanisms capable of preventing thermal runaway for batteries to be considered safe products. Safety pressure remained visible in 2025. London recorded 134 e-bike fires by 28 September 2025, within 165 combined e-bike and e-scooter fires reported in the capital by that date. These numbers directly affect manufacturers, importers, retailers, conversion-kit providers, fleet operators and repair networks because safety failures can trigger tighter product testing, charger compatibility rules, documentation obligations and enforcement activity. The challenge is commercially important within a macroeconomic environment in which the global economy produced approximately USD 110.98 trillion of GDP in 2024, while World Bank data recorded global carbon emissions of 4.7 tonnes per person. Governments therefore face two simultaneous objectives: enabling lower-emission transport alternatives while ensuring that electrification does not introduce unacceptable household and building-fire risks.
Regulation, Road Safety and Infrastructure Consistency
Regulatory fragmentation and road-safety requirements remain major challenges for e-bike adoption because manufacturers and operators must function across jurisdictions with different definitions, speed restrictions, infrastructure standards, certification rules and enforcement priorities. E-bikes occupy an unusual regulatory position between conventional bicycles and motor vehicles, meaning relatively small differences in motor assistance, speed or equipment configuration can determine where a product may legally operate. Europe commonly treats pedal-assist bicycles within a framework in which electric assistance is limited to approximately 25 kilometres per hour, a classification that affects vehicle design and access to cycling infrastructure. Regulatory tightening is also visible in major US cities. New York City adopted a citywide 15-mile-per-hour speed limit for e-bikes and e-scooters taking effect on 24 October 2025, demonstrating how local governments are increasingly developing explicit operating rules as electrically assisted two-wheelers become more common. Safety statistics explain why these measures matter. New York City analysis published in 2024 identified 146 rider fatalities involving e-bikes, stand-up scooters and mopeds after 2020, compared with 29 fatalities between 2010 and 2020. The same analysis recorded 8 pedestrian fatalities involving e-bikes, scooters and mopeds from 2020 through 2023 within 449 total pedestrian fatalities, while 1,276 pedestrian injuries involved these micromobility modes within 28,450 total pedestrian injuries during the period examined. Although some of these figures combine vehicle categories, they show why cities are strengthening operating rules, street design and enforcement around electric micromobility. The challenge is intensified by uneven infrastructure availability. European Commission reporting in 2025 identified more than 900,000 kilometres of cycle paths across Europe, but also explicitly reported substantial differences in infrastructure availability between regions. The Commission identified more than 270 measures through national cycling contacts and urban-mobility coordination, indicating that policy development remains highly decentralised even within a relatively integrated market. Macroeconomic conditions make this regulatory challenge consequential.
Market Opportunities
Cargo E-Bikes and Last-Mile Fleet Electrification
Cargo mobility represents a significant future-growth opportunity for the e-bike market because dense urban delivery networks create operating conditions in which smaller electrically assisted vehicles can substitute for larger road vehicles on selected short-distance routes. The opportunity is already supported by current government action rather than hypothetical future demand. New York City changed its traffic rules during 2024 to explicitly authorise delivery companies to use pedal-assist e-cargo bicycles, establishing a formal regulatory pathway for commercial cargo-bike deployment in one of the world’s densest urban delivery environments. The city simultaneously launched a public e-bike charging pilot during 2024, installing more than 100 charging points across 5 locations to evaluate safe charging infrastructure for delivery workers. These initiatives are important for market development because commercial riders typically require higher vehicle utilisation, longer operating hours, dependable charging and more frequent battery cycles than recreational consumers. Cargo and delivery applications therefore create demand not only for complete e-bikes but also for batteries, certified chargers, telematics, maintenance, replacement components, secure parking and fleet-management services. The broader macroeconomic environment supports this opportunity. World Bank data place global GDP at approximately USD 110.98 trillion in 2024, illustrating the enormous volume of economic activity generating parcel, food, retail and business-to-business transportation requirements, while global carbon emissions were 4.7 tonnes per person in 2024. In major consumer economies, the emissions baseline is considerably higher, reaching 13.6 tonnes per person in the United States and 5.5 tonnes per person in the European Union during 2024. This provides policy justification for cities to evaluate lower-emission delivery modes alongside conventional vans and trucks. Commercialisation is also becoming linked with stricter safety requirements. New York City’s 2025 e-bike trade-in programme allows qualifying food-delivery workers to replace uncertified equipment with certified e-bikes and certified spare batteries, directly connecting fleet electrification with product-quality standards. Meanwhile, the city created a dedicated sustainable-delivery framework in 2025 with responsibilities covering e-bikes, e-scooters, commercial cyclists and delivery companies.
Connected Fleet E-Bikes, Safe Charging and Battery Ecosystems
Connected e-bikes and managed battery ecosystems offer another future-growth avenue because high-utilisation commercial and urban riders increasingly require more than a motor and battery; they require systems capable of supporting safe charging, battery identification, maintenance scheduling, speed governance, asset tracking and fleet accountability. Current public-sector initiatives already demonstrate the infrastructure conditions around which these services can develop. New York City’s 2024 e-bike charging pilot deployed more than 100 charging points at 5 locations for delivery workers, providing a real-world environment where charging usage, equipment reliability and rider behaviour can be managed through dedicated infrastructure rather than unregulated residential charging. In 2025, the city expanded its safety approach through an e-bike trade-in programme under which eligible delivery workers could exchange uncertified equipment for a certified e-bike accompanied by a certified spare battery. The combination of certified vehicles, identifiable batteries and formal charging locations provides a stronger platform for connected battery-management technology, diagnostics and fleet-management services. Safety data further justify this opportunity. UK product-safety authorities recorded 170 e-bike fires in 2024, including 77 incidents involving confirmed post-market conversions, while London recorded 134 e-bike fires by 28 September 2025. These incidents increase the value of technology that can improve traceability, identify incompatible charging behaviour, manage battery condition and assist operators in removing unsafe equipment from service. Regulatory developments are also increasing the relevance of software-controlled vehicle functions. New York City introduced a 15-mile-per-hour e-bike and e-scooter speed limit effective 24 October 2025, illustrating how connected speed management and geofencing can become useful fleet-compliance capabilities where operators need to manage many vehicles consistently. Europe presents a larger infrastructure base for such connected services. European Commission reporting identified more than 900,000 kilometres of cycle paths in 2025, while 26 EU Member States participated in a network of national cycling contact points. At macroeconomic level, the World Bank records approximately USD 110.98 trillion of global GDP in 2024, global carbon emissions of 4.7 tonnes per person, US emissions of 13.6 tonnes per person, and EU emissions of 5.5 tonnes per person.
Future Outlook
The UK Low-Speed Two-Wheelers Vehicle Market is expected to expand at approximately ~X.X% CAGR over the forecast period. Growth will increasingly depend on everyday mobility rather than pandemic-era recreational bicycle purchasing. Expansion of protected cycling infrastructure, commercial cargo-bike deployments, employer-supported bicycle acquisition and better battery technology should broaden the addressable user base. The strongest opportunity is likely to emerge at the intersection of commuting, logistics and connected mobility. Government policy is increasingly supportive of walking, wheeling and cycling for short urban journeys; England’s current active-travel strategy sets a long-term ambition for 55% of short stages in towns and cities to be walked or cycled. This provides a structural policy tailwind for EAPCs, cargo e-bikes, supporting infrastructure. Commercial fleets will become a more important purchasing group as parcel, grocery and food-delivery operators seek vehicles with lower urban operating costs. Cargo e-bikes are especially relevant where payload requirements exceed those of conventional commuter models but do not justify a van. Fleet buyers will increasingly evaluate battery cycle life, vehicle uptime, payload, theft protection, service response and cost per delivery rather than simply acquisition price. Regulation will remain decisive. EAPCs retain a comparatively straightforward legal proposition, whereas electric mopeds require greater compliance and rental e-scooters continue to operate within government-sanctioned trials.
Major Players
- Brompton Bicycle Ltd.
- VOLT Bikes
- Gocycle
- Raleigh
- Cowboy
- TENWAYS
- Specialized Bicycle Components
- Trek Bicycle Corporation
- CUBE Bikes
- NIU Technologies
- Vmoto / Super Soco
- Yadea Group
- HORWIN
- Silence
- Lexmoto
Key Target Audience
- Electric Bicycle and Low-Speed Electric Two-Wheeler Manufacturers
- Battery, Motor, Controller and Powertrain Component Manufacturers
- Bicycle, Electric Moped and Micromobility Distributors and Dealer Networks
- Last-Mile Delivery, Parcel, Grocery and Urban Logistics Fleet Operators
- Shared E-Bike and Rental E-Scooter Fleet Operators
- Leasing, Subscription and Fleet-Financing Providers
- Investments and Venture Capitalist Firms
- Government and Regulatory Bodies (Department for Transport, Driver and Vehicle Standards Agency, Driver and Vehicle Licensing Agency, Office for Product Safety and Standards, Transport for London and Active Travel England)
Research Methodology
Step 1: Identification of Key Variables
The research begins by defining the UK low-speed two-wheeler ecosystem, including EAPC manufacturers, electric moped brands, component suppliers, importers, dealers, fleet operators and shared-mobility providers. Secondary research is used to identify critical variables including unit sales, motor power, battery capacity, average selling price, replacement cycle, fleet utilisation, regulatory class and distribution structure. Official sources such as the Department for Transport and Transport for London are combined with Bicycle Association and Motorcycle Industry Association information. Particular attention is given to distinguishing conventional EAPCs from type-approved powered cycles, electric mopeds and regulated rental e-scooters because their licensing, operating and purchasing economics differ materially.
Step 2: Market Analysis and Construction
Historical market construction follows both top-down and bottom-up approaches. The top-down model evaluates the wider UK bicycle and L-category vehicle markets before isolating low-speed electric categories. The bottom-up model aggregates estimated brand sales, dealer throughput, registrations, fleet procurement and shared-mobility vehicle deployment to establish the addressable market. Unit volumes are reconciled against pricing by vehicle type and powertrain. E-bike industry data, L-category registration information and fleet deployment indicators are cross-checked to minimise double counting. Where shared vehicles are considered, vehicle procurement value is separated from ride-service revenue so that the report measures the vehicle market rather than the broader mobility-services economy.
Step 3: Hypothesis Validation and Expert Consultation
Initial hypotheses are validated through structured interviews with OEM executives, specialist bicycle retailers, electric-moped distributors, fleet procurement managers, repair networks and micromobility operators. Computer-assisted telephone interviews and expert discussions are used to validate market penetration, average selling prices, vehicle replacement rates, commercial utilisation, battery replacement behaviour and channel margins. Primary discussions also examine market-specific issues including EAPC compliance, high-power conversion kits, battery safety, theft, financing and fleet maintenance. Feedback is used to test whether secondary market indicators accurately represent actual sell-through rather than shipments or dealer inventory.
Step 4: Research Synthesis and Final Output
All primary and secondary findings are triangulated at vehicle type, end-use, sales-channel and geographic levels. Brand-level estimates are reconciled against industry totals, while pricing and specification databases are used to convert unit demand into market value. Special attention is given to differences between privately owned EAPCs, commercially operated vehicles and regulated rental fleets. The final forecast applies scenario-based assumptions for commuting adoption, battery costs, fleet electrification, cycling infrastructure, household purchasing power and regulatory development. The resulting outlook provides a consistent market model linking vehicle demand, market value, competitive positioning and long-term growth opportunities.

- Executive Summary
- Research Methodology (Market Definitions and Assumptions, EAPC Definition, L1e-A/L1e-B Classification, Rental E-Scooter Treatment, Vehicle-In-Scope/Out-of-Scope Criteria, Market Sizing Approach, Top-Down Analysis, Bottom-Up Analysis, Registration Analysis, Import–Export Assessment, Retail Sell-Out Assessment, Dealer Checks, Fleet Procurement Assessment, Demand-Side Interviews, OEM and Distributor Interviews, Shared-Mobility Operator Interviews, Primary Industry Interviews, Secondary Research, Data Triangulation, ASP Modelling, Vehicle-Parc Modelling, Replacement-Cycle Modelling, Forecasting Framework, Scenario Analysis, Limitations and Future Conclusions)

- Definition and Scope
- Low-Speed Two-Wheeler Vehicle Ecosystem
- Evolution of Electric and Assisted Two-Wheeler Mobility in the UK
- Market Value Chain Analysis
- Market Revenue Pool Mapping

- Growth Drivers (Urban Congestion, Cycling Infrastructure, Fuel Cost, Public-Transport Cost, Last-Mile Delivery Growth, Sustainability Targets, Cycle-to-Work Adoption, Low-Emission Mobility)
- Market Challenges (Purchase Price, Battery Safety, Theft, Insurance, Regulation, Infrastructure, Weather, Repair Network, Battery Replacement Cost, Consumer Awareness)
Market Trends (Connected Mobility, Subscription, Cargo E-Bikes, Removable Batteries, Geofencing, Telematics, Lightweighting, Safety Certification) - Market Opportunities (Addressable Riders, Fleet Electrification, Cargo Mobility, Subscription, Battery Swapping, Connected Vehicles, Domestic Assembly, Aftermarket)
- Regulatory and Policy Analysis (EAPC Power Limit, Assistance Cut-Off Speed, L-Category Type Approval, Registration, Licensing, Insurance, Product Safety, Battery Compliance, E-Scooter Trial Rules)
- SWOT Analysis
- Porters five forces

- By Market Value (2020-2025)
- By New Vehicle Unit Sales (2020-2025)
- By Installed Vehicle Parc (2020-2025)
- By Average Selling Price (2020-2025)
- By Replacement Vehicle Demand (2020-2025)
- By Vehicle Category Contribution (2020-2025)

- By Vehicle Type (In Value %)
Electrically Assisted Pedal Cycles
Urban/Commuter E-Bikes
Folding E-Bikes
Electric Cargo Bikes
Utility and Delivery E-Bikes
Electric Mopeds/Scooters
Low-Power Powered Cycles
Rental-Trial E-Scooters
Private-Land Low-Speed E-Scooters - By Regulatory Vehicle Class (In Value %)
EAPC-Compliant Vehicles
L1e-A Powered Cycles
L1e-B Two-Wheel Mopeds
Type-Approved Twist-and-Go Electric Cycles
Rental-Trial E-Scooters
Non-Road/Public-Highway Private Mobility Vehicles - By Maximum Assisted/Design Speed (In Value %)
Up to 15.5 mph
Above 15.5 mph to 20 mph
Above 20 mph to 28 mph
Speed-Restricted Commercial Fleet Vehicles
Geofenced Shared-Mobility Vehicles - By Vehicle Range (In Value %)
Up to 25 Miles
Above 25 to 40 Miles
Above 40 to 60 Miles
Above 60 Miles
Multi-Battery Extended-Range Vehicles - By Price Band (In Value %)
Entry-Level
Mass-Market
Mid-Premium
Premium
Specialist/Commercial
Fleet-Specification Vehicles - By Geography (In Value %)
Greater London
South East England
South West England
East of England
West Midlands
East Midlands
North West England
North East England
Yorkshire and the Humber
Scotland
Wales
Northern Ireland

- Market Share of Major Players by Value
- Cross Comparison of Major Market Participants (Maximum Assisted/Design Speed, Continuous Motor Power, Usable Battery Capacity, Real-World Range, Battery Removability/Swapping, Retail Price/ASP, UK Dealer & Service Coverage, Warranty & Connected Anti-Theft Capability)
- SWOT Analysis of Major Market Participants (Product Strength, Pricing, Technology, Brand Equity, Distribution, After-Sales Service, Fleet Capability, Regulatory Exposure)
- Competitive Pricing Matrix (Vehicle Model, Vehicle Type, Motor Power, Battery Capacity, Claimed Range, Retail Price, Finance Payment, Warranty, Cost per Mile)
- Detailed Profiles of 15 Major Companies
Brompton Bicycle Ltd.
VOLT Bikes
Gocycle
Raleigh
Cowboy
TENWAYS
Specialized Bicycle Components
Trek Bicycle Corporation
CUBE Bikes
NIU Technologies
Vmoto / Super Soco
Yadea Group
HORWIN
Silence
Lexmoto

- Consumer Adoption Behaviour Assessment
- Demographic Consumption Analysis
- Commuter Mobility Behaviour Analysis
- Purchase Decision Analysis
- Product Feature Preference Analysis

- By Market Value (2026-2035)
- By New Vehicle Unit Sales (2026-2035)
- By Installed Vehicle Parc (2026-2035)
- By Average Selling Price (2026-2035)
- By Replacement Vehicle Demand (2026-2035)
- By Vehicle Category Contribution (2026-2035)


 Request a Sample
 Ask for Customization
 Get a Quote
 Enquire Now