

 Download PDF
Market Overview
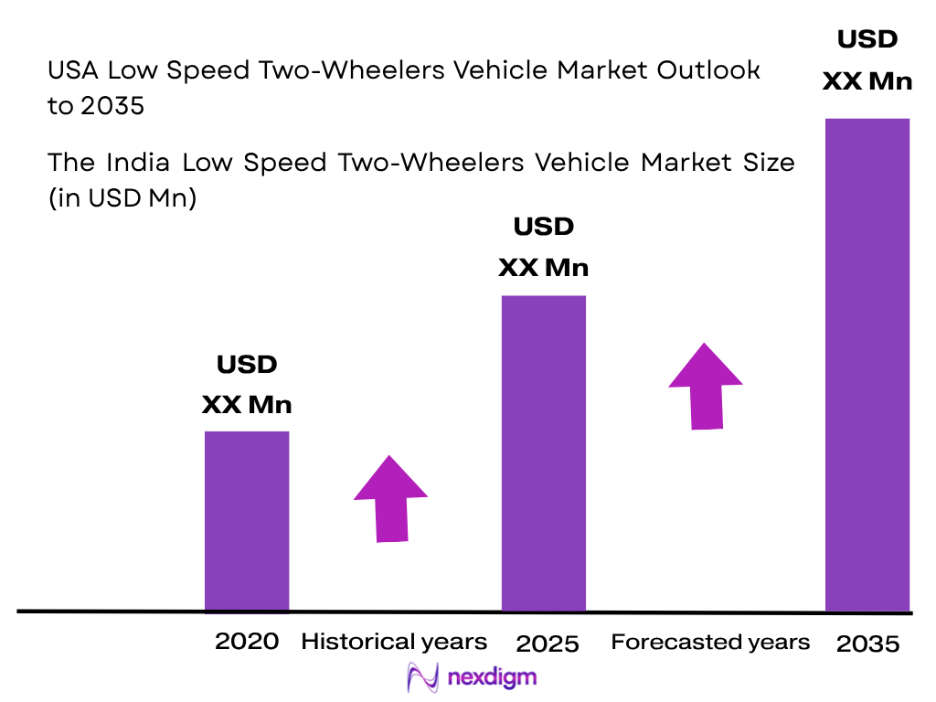
The USA Low Speed Two-Wheelers Vehicle Market is valued at ~USD X.X billion, compared with ~USD Y.Y billion in the preceding annual benchmark, supported by accelerating adoption of electric bicycles, electric scooters, low-speed mopeds and cargo-oriented two-wheelers. More than 500,000 e-bikes were sold in the U.S. in the preceding benchmark, while shared micromobility generated 133 million U.S. trips, demonstrating substantial utilization of lightweight mobility solutions.
Demand is supported by urban commuting, delivery applications and short-distance car substitution. New York City is the country’s most visible low-speed two-wheeler demand center, alongside major urban markets such as San Francisco, Washington D.C., Los Angeles, Chicago and Portland, where density, congestion, transit connectivity and cycling infrastructure support micromobility use. Citi Bike alone recorded more than 29 million e-bike trips in its latest annual benchmark, while New York City’s bicycle network extends approximately 1,550 lane miles, providing an unusually mature operating environment for electric bicycles and other compatible low-speed vehicles. Federal product classification is an important boundary for this market. The U.S. Consumer Product Safety Commission defines a low-speed electric bicycle around fully operable pedals, an electric motor below 750 watts, and motor-only maximum speed below 20 mph under prescribed testing conditions. State rules can further distinguish Class 1, Class 2 and Class 3 configurations, making regulatory configuration an important consideration for manufacturers, retailers and consumers.
Market Segmentation
By Vehicle Type
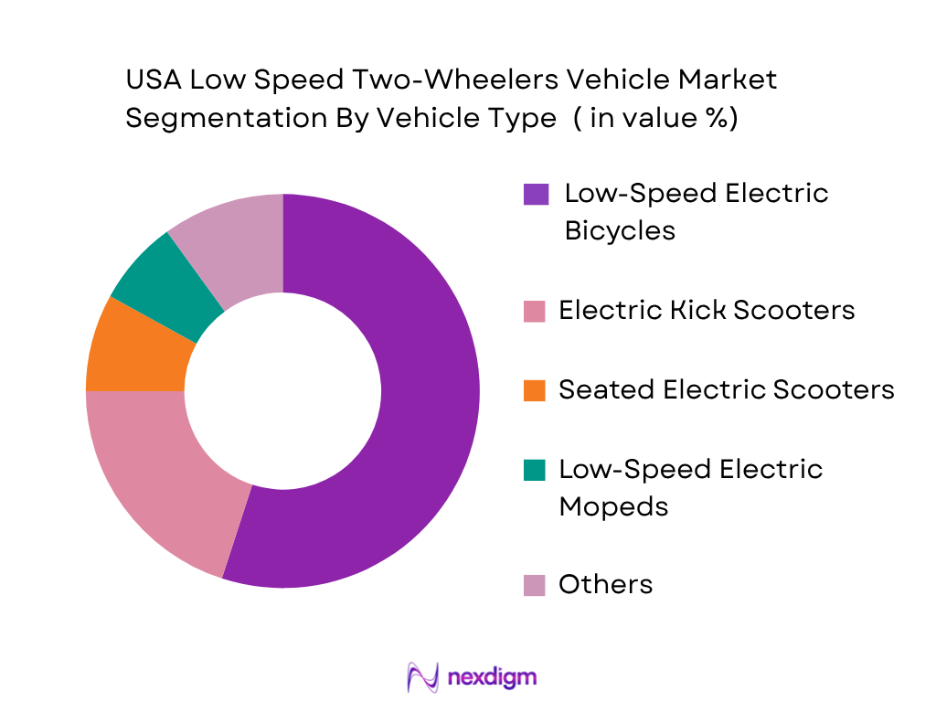
The USA Low Speed Two-Wheelers Vehicle Market is segmented by vehicle type into low-speed electric bicycles, electric kick scooters, seated electric scooters, low-speed electric mopeds, and utility/cargo electric two-wheelers. Low-speed electric bicycles hold the dominant position because they combine conventional bicycle functionality with electric assistance while fitting within a comparatively established regulatory and retail ecosystem. Their adoption spans commuting, recreation, family mobility and last-mile transportation. Consumers can access products through independent bicycle dealers, specialist e-bike stores and direct-to-consumer platforms. The category also benefits from product diversity, including commuter, folding, cruiser, fat-tire, mountain and cargo configurations. More than 500,000 e-bikes were sold in the U.S. during the cited industry benchmark, illustrating the scale that this vehicle format has achieved. Increasing adoption of torque sensors, integrated batteries, removable packs and connected features further strengthens the category’s position relative to more narrowly used low-speed formats.
By Sales Channel
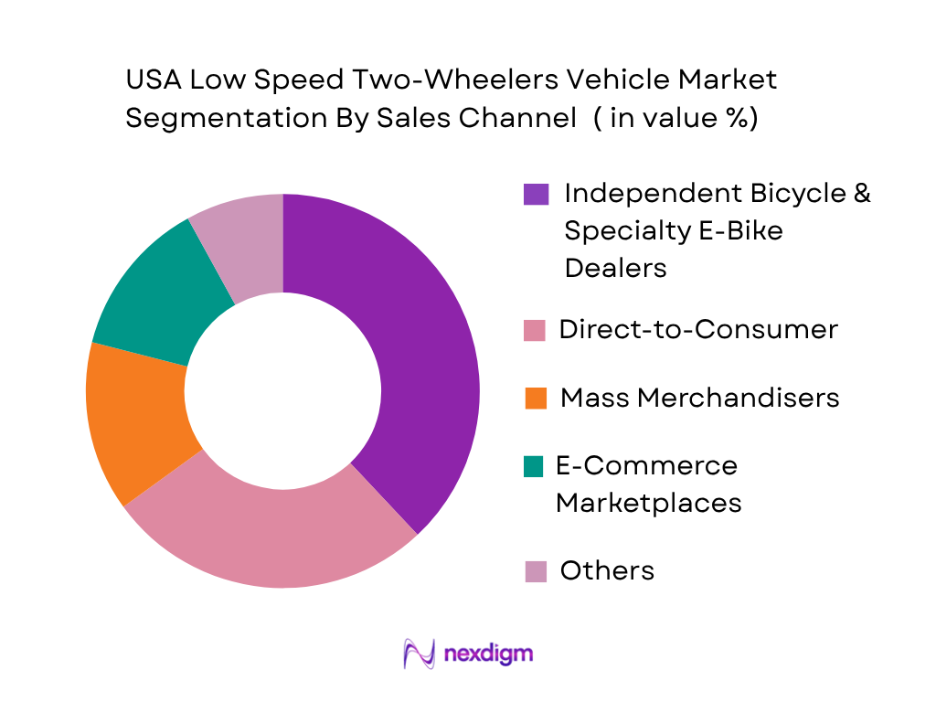
The USA Low Speed Two-Wheelers Vehicle Market is segmented by sales channel into independent bicycle and specialty dealers, direct-to-consumer channels, mass merchandisers, online marketplaces, and fleet/institutional procurement. Independent and specialty dealers remain a strategically important channel because low-speed electric two-wheelers require test rides, vehicle fitting, assembly, diagnostics, battery support and mechanical servicing to a greater extent than conventional online consumer products. The dealer channel is particularly relevant to premium commuter, mountain and mid-drive e-bikes, where buyers value professional guidance and post-purchase support. Direct-to-consumer brands nevertheless exert strong competitive pressure by reducing distribution layers and targeting value-oriented buyers. People For Bikes reported that e-commerce represented only a small portion of tracked bike-shop e-bike sales in an early benchmark but was expanding rapidly, indicating increasing omnichannel behavior rather than outright disappearance of physical retail. Click-and-collect models can therefore combine online discovery with local assembly and servicing.
Competitive Landscape
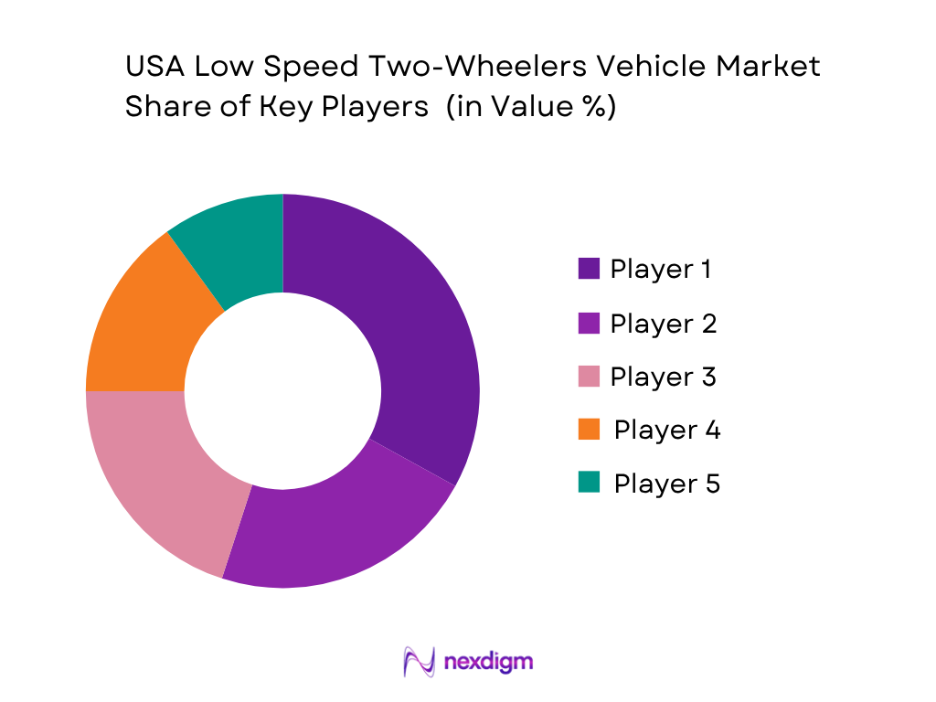
The USA Low Speed Two-Wheelers Vehicle Market combines established global bicycle manufacturers with rapidly scaling electric-native brands. Trek, Specialized and Giant leverage broad bicycle portfolios, engineering capabilities, physical dealer networks and established service ecosystems, while Aventon and Lectric eBikes have expanded the competitive field through digitally led distribution, accessible pricing and products designed around commuter, utility and recreational use cases. The resulting market structure creates competition across price, range, motor architecture, battery capacity, dealer availability, service support and regulatory configuration. Trek traces its history to Wisconsin in 1976, Specialized to California in 1974, Giant to Taiwan in 1972, Aventon to California in 2012, and Lectric to the late 2010s in the United States.
| Major Player | Establishment | Headquarters | E-Bike Portfolio Focus | Primary Drive Architecture | Regulatory/Class Coverage | Battery Architecture | Distribution Model | Service Positioning |
| Trek Bicycle Corporation | 1976 | Waterloo, Wisconsin, USA | ~ | ~ | ~ | ~ | ~ | ~ |
| Specialized Bicycle Components | 1974 | Morgan Hill, California, USA | ~ | ~ | ~ | ~ | ~ | ~ |
| Giant Group / Giant Bicycles | 1972 | Taichung, Taiwan | ~ | ~ | ~ | ~ | ~ | ~ |
| Aventon | 2012 | Brea, California, USA | ~ | ~ | ~ | ~ | ~ | ~ |
| Lectric eBikes | 2018 | Phoenix, Arizona, USA | ~ | ~ | ~ | ~ | ~ | ~ |
USA Low Speed Two-Wheelers Vehicle Market Analysis
Growth Drivers
Urban Trip Electrification and Short-Distance Car Replacement
Urban trip electrification is becoming a structural growth driver for the USA Low Speed Two-Wheelers Vehicle Market as large metropolitan areas combine dense populations, lengthy commuting patterns, expanding cycling networks and increasingly visible e-bike usage. The U.S. Census Bureau estimated the national population at 340.1 million people in 2024, including 293.9 million residents living in metropolitan areas, creating a large addressable base for short-distance alternatives to passenger cars. The average one-way U.S. commute reached 27.2 minutes in 2024, reinforcing the relevance of flexible modes for first-mile, last-mile and neighborhood transportation. New York City provides a particularly strong indicator of actual low-speed two-wheeler utilization. Citi Bike registered more than 44 million rides during 2024, while the system recorded a single-day peak of 193,645 rides on September 20. The city also reported more than 620,000 cycling trips on a typical day, indicating that bicycles and electrically assisted bicycles have moved well beyond occasional recreational use in one of the country’s largest mobility markets. E-bike intensity within shared mobility is also substantial: Citi Bike logged more than 29 million e-bike trips in 2024, and its operating fleet subsequently included approximately 15,000 pedal-assist e-bikes alongside more than 20,000 conventional bicycles. These figures are important for the broader low-speed two-wheeler industry because repeated shared-mobility exposure familiarizes commuters with electric assistance, battery charging, app-based access and bicycle-lane travel, lowering behavioral barriers to personal e-bike, scooter and utility-bike ownership.
Cycling Infrastructure Expansion and Micromobility Network Development
Cycling infrastructure expansion is strengthening the operating environment for low-speed two-wheelers by creating more continuous, separated and visible routes across major U.S. metropolitan areas. New York City maintained approximately 1,550 lane miles of bicycle infrastructure and added 29.3 miles of protected bicycle lanes during 2024, providing physical capacity for regular commuting, recreation, shared e-bike use and commercial utility-bike movements. The city estimates approximately 226 million cycling trips annually, demonstrating the level of travel activity that can develop where roadway infrastructure and cycling networks reach meaningful scale. Infrastructure investment is not limited to New York. At the federal level, the Safe Streets and Roads for All program provides USD 5 billion across five years through 2026 for regional, local and Tribal road-safety projects; by the latest program update it had already supported projects in more than 1,400 communities. Such investments are significant for low-speed two-wheelers because protected corridors, traffic-calming projects, safer intersections and multimodal street redesigns directly affect where e-bikes and scooters can be used with acceptable perceived risk.
Market Challenges
Battery Fire Risk, Charger Compatibility and Product-Safety Compliance
Battery safety remains one of the most consequential challenges for the USA Low Speed Two-Wheelers Vehicle Market because electric bicycles, scooters and related vehicles combine lithium-ion battery packs, chargers, battery-management systems and high-current electrical components within products frequently stored or charged inside residences. New York City recorded 277 lithium-ion battery fires during 2024, including 133 fires occurring outside residential or commercial structures, while the city recorded 6 deaths associated with lithium-ion battery incidents during the same year. Earlier during 2024, city authorities had already documented 222 lithium-ion battery fires, 88 injuries and 4 fatalities by late October, illustrating why battery safety became a regulatory and operating priority for the micromobility ecosystem. Charger compatibility represents another identifiable risk. The U.S. Consumer Product Safety Commission reported receiving 156 fire and thermal-incident reports involving so-called universal chargers between January 2023 and May 2024, including incidents involving property damage and serious injuries. The problem extends beyond isolated charger misuse because low-speed two-wheelers increasingly circulate through online marketplaces, aftermarket battery channels and conversion-kit ecosystems where the battery, charger and vehicle electrical system may not originate from one validated manufacturer.
Regulatory Fragmentation and Vehicle-Classification Complexity
Regulatory fragmentation creates a persistent market challenge because low-speed electric two-wheelers operate across overlapping federal product-safety rules, state vehicle classifications and municipal operating requirements. At the federal level, the U.S. Consumer Product Safety Commission’s low-speed electric bicycle framework is built around fully operable pedals, an electric motor below 750 watts, and a motor-only maximum speed below 20 miles per hour under specified conditions. Local operating rules can be materially different. New York City, for example, imposes a 15-mile-per-hour speed limit on e-bikes, e-scooters and pedal-assist bicycles, demonstrating how a product that fits within a federal consumer-product definition may still face more restrictive local operating parameters. This distinction is commercially significant because manufacturers increasingly sell multi-class, throttle-enabled and software-configurable products nationally through direct-to-consumer and marketplace channels. A single product platform can therefore encounter different rules for speed, throttle functionality, age restrictions, helmet use, road access or registration depending on where the buyer operates it. Regulatory complexity also extends into electrical safety. New York City requires powered bicycles sold, leased or rented within the city to satisfy applicable third-party certification requirements associated with UL 2849, while personal e-mobility devices are addressed through UL 2272 and batteries through UL 2271.
Market Opportunities
Cargo E-Bikes and Commercial Last-Mile Delivery Fleets
Cargo e-bikes represent a significant future growth opportunity for the USA Low Speed Two-Wheelers Vehicle Market because public authorities are increasingly integrating lightweight electric freight vehicles into dense urban delivery systems. The opportunity is supported by demonstrated operating activity rather than theoretical projections. NYC DOT formally authorized electric cargo bikes for commercial use on city streets in 2024, converting an earlier pilot framework into a defined operating pathway for businesses handling local and last-mile deliveries. By 2025, the city reported that commercial cargo-bike deployment had grown at least seven-fold since the pilot program began, showing that logistics operators can expand utilization when street rules and curb-management arrangements support the vehicle format. Freight-management infrastructure is developing alongside vehicle authorization. NYC DOT installed more than 500 new loading zones during 2024, adding to nearly 3,000 loading zones introduced since late 2021; these zones are intended to reduce double parking and improve curb access, conditions directly relevant to cargo-bike delivery productivity. The city also advanced dedicated microhub concepts in 2024, with proposed zones of approximately 80 to 100 feet designed for package transfer from larger vehicles to cargo bikes, handcarts and smaller electric vehicles. This operating architecture creates opportunities for vehicle manufacturers beyond conventional consumer e-bikes.
Certified Battery Systems, Secure Parking and Connected Anti-Theft Ecosystems
Certified battery systems and integrated vehicle-security technologies represent another future-oriented opportunity because current safety incidents and storage constraints are pushing low-speed two-wheeler buyers toward products with stronger electrical compliance, controlled charging and theft protection. The opportunity is supported by an identifiable safety problem New York City recorded 277 lithium-ion battery fires in 2024, prompting continued government emphasis on certified batteries, safe chargers and alternatives to uncontrolled residential charging. CPSC separately documented 156 fire and thermal incidents linked to universal micromobility chargers through May 2024, demonstrating the risks created when consumers use chargers that are not properly matched to specific battery systems. These conditions increase the strategic value of integrated electrical architectures in which the battery pack, battery-management system, charger and drivetrain are validated together. UL 2849 specifically evaluates e-bike electrical systems as combinations of drivetrain, battery and charger components, creating a recognized pathway for manufacturers seeking to demonstrate stronger product-safety controls. Infrastructure initiatives are also addressing ownership barriers beyond fire safety. NYC DOT initiated development of 500 secure bicycle-parking locations intended to accommodate e-bikes and cargo bikes, with locations prioritized near transit hubs and residential areas where private indoor storage may be limited. This creates room for connected locks, GPS modules, digital keys, movement alarms and vehicle-recovery systems to become more integral to product specifications. Digital readiness further supports these features: World Bank data indicate that the United States had 340.1 million residents in 2024, while national internet connectivity is already deeply established across households, making smartphone-linked vehicle management practical at broad scale.
Future Outlook
The USA Low Speed Two-Wheelers Vehicle Market is expected to expand at a forecast CAGR of ~XX.X% during the forecast period, supported by greater acceptance of electric-assisted mobility and continued product innovation. Commuter e-bikes, cargo platforms and compact utility vehicles are expected to become increasingly relevant for short-distance transportation. Greater emphasis on certified batteries and electrical systems should influence purchasing standards. Dealer-service capability, fleet adoption and city-level infrastructure development will increasingly determine competitive success. Cargo and utility vehicles represent a particularly important expansion avenue because they broaden the addressable market beyond recreation into family transport, grocery trips, urban logistics and commercial delivery. Product development is expected to focus on higher payload capacity, modular racks, passenger accessories, durable brakes, extended-range batteries and improved low-speed handling.
Major Players
- Trek Bicycle Corporation
- Specialized Bicycle Components
- Giant Group / Giant Bicycles
- Cannondale
- Aventon
- Lectric eBikes
- Ride1Up
- Pedego Electric Bikes
- Velotric
- Heybike
- SUPER73
- REI Co-op Cycles
- Gazelle
- Tern Bicycles
- Segway
Key Target Audience
- Electric Bicycle, Electric Scooter and Low-Speed Two-Wheeler Manufacturers
- Battery, Motor, Controller and Electric Drivetrain Suppliers
- Bicycle Dealers, Specialty E-Bike Retailers and E-Commerce Distributors
- Shared Micromobility, Last-Mile Delivery and Commercial Fleet Operators
- Logistics, Urban Mobility and Transportation Service Providers
- Investments and Venture Capitalist Firms
- Government and Regulatory Bodies (U.S. Consumer Product Safety Commission, U.S. Department of Transportation, National Highway Traffic Safety Administration, Federal Highway Administration)
- Private Equity Firms, Banks and Strategic Investors
Research Methodology
Step 1: Identification of Key Variables
The initial phase involves constructing the complete USA Low Speed Two-Wheelers Vehicle Market ecosystem, including OEMs, battery suppliers, motor suppliers, distributors, bicycle dealers, D2C brands, fleet operators and end users. Secondary research is used to establish vehicle definitions, regulatory boundaries, product configurations, pricing structures and channel dynamics. Federal CPSC definitions are incorporated to distinguish qualifying low-speed electric bicycles from higher-powered motor vehicles.
Step 2: Market Analysis and Construction
Historical industry information is evaluated through a combination of vehicle shipments, retail sell-through, imports, brand-level portfolios, average selling prices and fleet procurement. A bottom-up framework aggregates manufacturer and channel activity, while a top-down framework assesses overall bicycle, e-bike and shared micromobility adoption. Differences between sell-in, sell-through and operational fleet deployment are reconciled to minimize double counting.
Step 3: Hypothesis Validation and Expert Consultation
Market hypotheses are validated through structured primary interviews and computer-assisted telephone interviews with OEM executives, bicycle dealers, component suppliers, distributors, fleet operators and industry specialists. Interviews focus on product mix, vehicle classes, ASP movements, sales-channel contribution, inventory conditions, replacement cycles, motor and battery preferences, safety certification and regional demand. Primary findings are cross-checked against secondary evidence before inclusion.
Step 4: Research Synthesis and Final Output
The final phase triangulates top-down results, bottom-up calculations and primary interview findings into a unified market model. Brand-level and SKU-level analysis is used to validate segmentation, competitive positioning and pricing assumptions. Future demand is modeled using urban mobility adoption, regulatory evolution, infrastructure development, battery economics, replacement requirements and commercial fleet penetration to produce the final market outlook and strategic recommendations.

- Executive Summary
- Research Methodology (Market Definition & Scope Boundary, Low-Speed Vehicle Classification, Primary Interviews, OEM & Dealer Checks, Import Data Mapping, Retail SKU Tracking, Fleet Operator Interviews, Top-Down Market Sizing, Bottom-Up Market Sizing, Price-Volume Reconciliation, Shipment-to-Retail Adjustment, Replacement Demand Assessment, Data Triangulation, Forecasting Framework, Scenario Analysis, Assumptions & Limitations)

- Definition and Scope
- Market Evolution and Industry Genesis
- Evolution from Conventional Bicycles and Mopeds toward Electrified Micromobility
- Market Lifecycle and Adoption Maturity

- Growth Drivers (Urban Trip Electrification, Short-Distance Car Replacement, Cycling Infrastructure Expansion, Fuel and Parking Cost Avoidance, Cargo E-Bike Adoption, Last-Mile Delivery Electrification, Improved Battery Range, D2C Product Availability)
- Market Challenges (Regulatory Fragmentation, Battery Fire Concerns, Import Tariff Exposure, Dealer Inventory Pressure, Product Quality Variability, Theft Risk, After-Sales Service Gaps, Seasonal Demand)
- Market Opportunities (Cargo E-Bikes, Family Mobility, Commercial Delivery Fleets, Lightweight E-Bikes, Certified Battery Systems, Fleet Leasing, Subscription Models, Connected Anti-Theft Systems)
- Market Trends (Torque-Sensor Adoption, Integrated Batteries, Mid-Drive Premiumization, Lightweighting, Fat-Tire Demand, Connected Vehicles, GPS Anti-Theft, Omnichannel Retail)
- SWOT Analysis (Electrified Short-Distance Mobility, Import Dependence, Cargo/Commercial Opportunity, Regulatory & Safety Risk)
- Porter’s Five Forces Analysis (OEM Rivalry, Component Supplier Power, Dealer/Consumer Power, New D2C Entrants, Car/Transit/Scooter Substitution)
- PESTLE Analysis (Transport Policy, Consumer Affordability, Urban Mobility Behavior, Battery Technology, Product Liability, Environmental Impact)

- By Market Value (2020-2025)
- By New Vehicle Unit Sales (2020-2025)
- By Average Selling Price (2020-2025)
- By Installed/Operational Vehicle Fleet (2020-2025)
- By Replacement Vehicle Demand (2020-2025)
- By Retail versus Fleet Procurement Value (2020-2025)

- By Vehicle Type (In Value %)
Low-Speed Electric Bicycles
Electric Kick Scooters
Seated Electric Scooters
Low-Speed Electric Mopeds
Utility and Cargo Electric Two-Wheelers - By E-Bike Regulatory/Class (In Value %)
Class 1 Pedal-Assist
Class 2 Throttle-Assisted
Class 3 Pedal-Assist
Multi-Class / User-Configurable
State-Specific Low-Speed Configurations - By Vehicle Design/Application Format (In Value %)
City and Commuter
Cargo and Utility
Folding
Fat-Tire
Mountain and Trail - By Propulsion/Assist Mode (In Value %)
Pedal Assist Only
Throttle Assist
Pedal Assist plus Throttle
Software-Selectable Assist Modes - By Motor Configuration (In Value %)
Rear Hub Motor
Front Hub Motor
Mid-Drive Motor
Integrated/Proprietary Drive System - By Region (In Value %)
Northeast
Midwest
South
West

- Market Share of Major Players (Market Value, Unit Sales, Vehicle Category, Price Band, Sales Channel)
- Competitive Positioning Matrix (Price Positioning, Product Breadth, Performance, Dealer Reach, D2C Capability, Brand Awareness)
- Cross Comparison Parameters (Low-Speed Vehicle SKU Breadth, Class 1/2/3 Portfolio Coverage, Motor Power & Torque Range, Battery Capacity & Real-World Range, UL-Certified Electrical/Battery System Coverage, Dealer & Service Network Reach, D2C/Omnichannel Capability, Cargo/Utility & Fleet Product Capability)
- Pricing Benchmarking (Entry Price, Portfolio ASP, Premium Models, Discounting, Financing)
Brand-by-Brand SWOT Analysis (Product Strength, Channel Strength, Pricing Weakness, Service Exposure, Regulatory Risk) - Detailed Profiles of Major Companies
Trek Bicycle Corporation
Specialized Bicycle Components
Giant Group / Giant Bicycles
Cannondale
Aventon
Lectric eBikes
Ride1Up
Pedego Electric Bikes
Velotric
Heybike
SUPER73
REI Co-op Cycles
Gazelle
Tern Bicycles
Segway

- Consumer Demographic Profile
- Purchase Decision-Making Process
- Product Attribute Preference Analysis
- Consumer Price Sensitivity
- Range and Charging Expectations
- Safety Perception Analysis
- Online versus Dealer Purchase Behavior
- Brand Loyalty and Repurchase Analysis
- Consumer Pain-Point Analysis

- By Market Value (2026-2035)
- By New Vehicle Unit Sales (2026-2035)
- By Average Selling Price (2026-2035)
- By Installed/Operational Vehicle Fleet (2026-2035)
- By Replacement Vehicle Demand (2026-2035)
- By Retail versus Fleet Procurement Value (2026-2035)


 Request a Sample
 Ask for Customization
 Get a Quote
 Enquire Now